

On the day Boris Johnson announced 'Plan B' (8 December), the Telegraph ran this story:
Omicron Covid cases could soon exceed one million a day, says Sajid Javid
Omicron cases could exceed one million a day by the end of this month, on the current trajectory, the Health Secretary has said.
My immediate assumption was that the journalist had misunderstood and that Javid had said that England could have had a million cases of Omicron in total by the end of the month. It seemed impossible that the Health Minister would say something as crazy as one million infections per day.
But when I looked at the full quote from Javid's speech to Parliament, it seemed pretty clear that the Telegraph's interpretation was the right one.
"Although there are only 568 confirmed Omicron cases in the UK we know that the actual number of infections will be significantly higher."The UK Health Security Agency (UKHSA) estimates that the number of infections are approximately 20 times higher than the number of confirmed cases, and so the current number of infections is probably closer to 10,000.
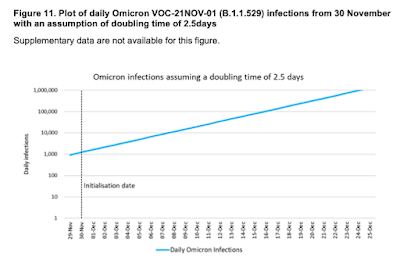
"UKHSA also estimate that at the current observed doubling rate of between two and a half and three days, by the end of this month, infections could exceed 1 million."
This is an insane way to make a projection and it produces a result that defies belief. If there were one million infections per day in the UK, the daily infection rate would be 14,700 per million! To my knowledge, there has never been a disease which spreads this quickly. Certainly, COVID-19 has never spread this quickly.
If we look at the countries that have had the biggest waves, the peaks were a fraction of this.
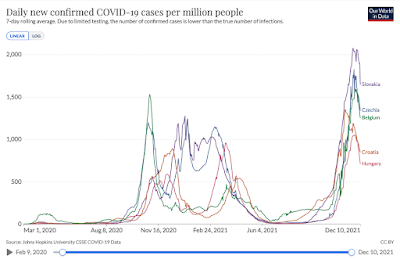
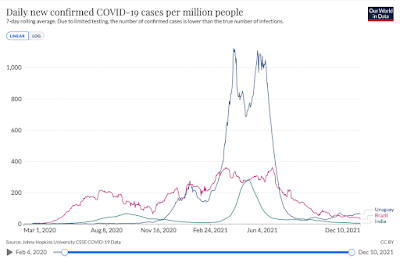
Admittedly, these countries brought some of these waves under control with restrictions (although less so with Delta after vaccines became available), but if we look at countries which had major waves without lockdowns, we see that they eventually subsided without reaching a peak of anything like 14,700 per million. It is important to note that Brazil and India were not testing anywhere near as much as European countries so the figures below are major underestimates. The actual peak in India, for example, was almost certainly ten or fifteen times times higher than shown here. Nevertheless, once you make a realistic estimate adjusting for under-counting, these countries all had very high rates of infection of perhaps 2,000-3,000 per million per day, maybe even 4,000 per million, but nothing like the 14,700 per million implicitly predicted by Javid.
Slightly confusingly, Javid talked about one million cases, but he was actually referring to one million infections. In the UK, testing picks up approximately 50 per cent of infections, so if we have 50,000 new cases in a day, we actually have around 100,000 new cases. Assuming testing could keep up with the tsunami of infections projected by Javid (which it wouldn't), we would be reporting 500,000 cases by the end of the month. Whichever way you look at it, the infection rate would be ten times higher than it has ever been in Britain and many times higher than it has ever been anywhere.
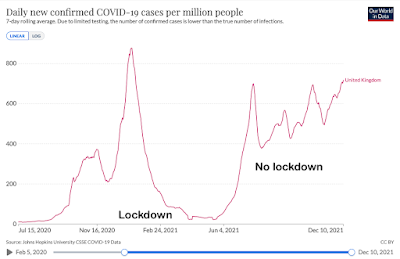
In January 2021, case numbers peaked in the UK at 900 per million. In practice, infections peaked at around 1,800 per million. Without vaccines, this was not good, and without the lockdown it would surely have risen further, but evidence from the rest of the world suggests that it would have reached a ceiling long before it got to 14,700 per million. Why? There are various reasons, but partly because the number of susceptible people falls as the number of infected people rises, and partly because people take more of an effort to protect themselves when the virus is rampant. You don't get steep exponential growth for more than a few weeks although you can have high rates for months, as the UK has shown since July.
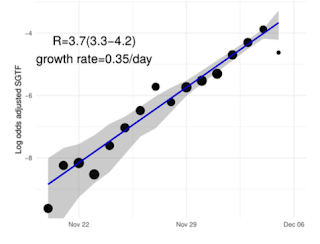
So how the hell does the UK Health Security Agency (UKHSA) arrive at a figure of one million infections per month? They published their findings yesterday and they are a joke. First, they estimate that the growth rate of Omicron in the UK was 0.35 (ie. 35%) between 20 November and 5 December. This is a doubling time of two and half days.
Second, they assume that this growth will continue at the same rate until Christmas.
UKHSA call this modelling. It is not. Modelling requires some realistic assumptions. This is simplistic and pointless mathematics. The UKHSA 'model' explicitly ignores all the factors that would have an impact on the spread of the virus.
This trajectory does not account for possible changes in behaviour in response to high prevalence of the virus.
Moreover....
-
The path of modelled future infections is highly sensitive to the assumed doubling time over the modelled period.
The assumed doubling time is 2.5 days. If you assume that this will be constant, the graph above can be drawn up in a few minutes using mental arithmetic. But there is no reason to think it will.
Firstly, the apparent growth rate of a virus in its early stages tends to be higher than it becomes in the medium to long term. In the first days and weeks, surge testing finds asymptomatic cases who would otherwise be missed. Intensive contact tracing has the same effect. When a virus is brought in from abroad, an infected traveller is likely to encounter more people than average because they are going to a conference, a wedding, a business meeting or whatever.
Secondly, we can already see from South Africa that the very high growth rate seen in late November and early December is not being maintained. Daily cases are shown below (virtually all of them are Omicron).
26/11: 2,828
27/11: 3,220
28/11: 2,858
29/11: 2,273
30/11: 4,373
1/12: 8,561
2/12: 11,535
3/12: 16,055
4/12: 16,356
5/12: 11,125
6/12: 6,381
7/12: 13,143
8/12: 19,842
9/12: 22,391
10/12: 19,018
The usual caveats apply to testing and the weekend effect, but it seems that the number of daily cases rose roughly four of five-fold between 28 November and 4 December, a doubling time of about two days. Since then, unless some very big numbers are announced in the next few days, the doubling time has greatly slowed down.
The UKHSA 'model' is worthless, but what are politicians supposed to do when they are presented with a graph which shows them, in effect, that the UK is heading towards an unprecedented outbreak of disease? If they ignored it, they would be accused of being anti-scientific neanderthals. But it should have been ignored because it is garbage.
Instead, the figure of a million infections by the end of January is cited in the House of Commons and reported by the media as if it were a plausible - nay, likely - outcome unless the government acts immediately. It was, to a large extent, the justification for Plan B.
This is not good enough. Omicron is a worrying variant. It is likely to spread rapidly and become the dominant strain in the next few weeks. Two doses of the vaccines seem to offer little protection against symptomatic disease (although UKHSA note that protection against severe disease and death 'is likely to be substantially
higher than the estimates against symptomatic disease' and boosters seem highly effective against the lot).
The situation is concerning enough without idiotic junk science exaggerating the threat.
No comments:
Post a Comment