The campaign to make people believe that moderate drinking is bad for their health resumed today with a study in JAMA Network Open. Those who follow such things closely will be unsurprised to hear that it was produced by Tim Stockwell and his colleagues at the Canadian Institute for Substance Use Research.
Stockwell has waged a one man crusade against the benefits of drinking for over a decade. He is past president of the neo-temperance Kettil Bruun Society and was involved - and heavily cited - in the process that lowered the UK drinking guidelines for no good reason. Along with his colleague Tim Naimi, he has since been at the helm of efforts to reduce Canada’s guidelines to two drinks per week. Despite being slapped down by experts in the field, he continues to produce countless journal articles casting doubt on the benefits of moderate drinking. Today’s publication is his third attempt at making a meta-analysis that erases the J-Curve.
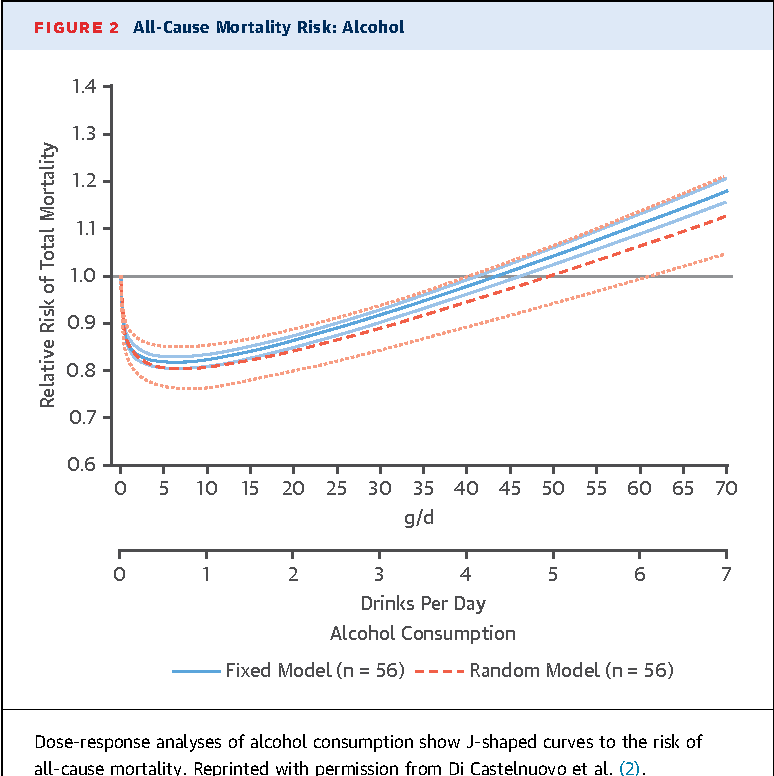
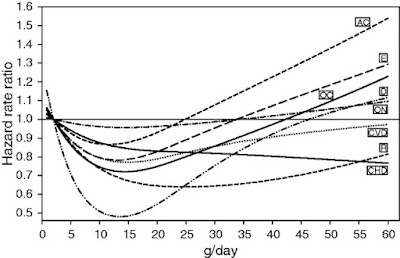
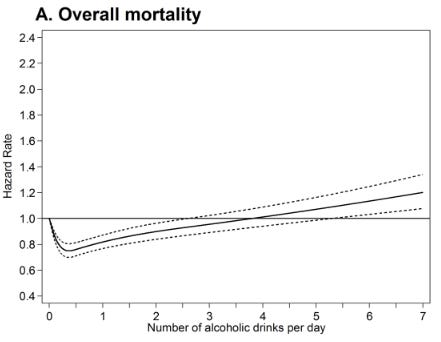
The J-Curve shows the well established finding that the health risks of drinking fall and then rise in proportion to consumption. Temperance activists hate it because it shows that drinking nothing is worse for you than drinking a bit.
The copium response to this is to say that some non-drinkers are ex-drinkers who used to drink a lot and wrecked their health. This possibility was first raised in the 1980s and has been comprehensively dealt with by numerous studies that exclude former drinkers and only compare drinkers to lifetime abstainers. The J-Curve holds.
Stockwell’s new study concludes:
This updated meta-analysis did not find significantly reduced risk of all-cause mortality associated with low-volume alcohol consumption after adjusting for potential confounding effects of influential study characteristics.
This conclusion will come as a shock to anyone who follows alcohol research. Barely a month goes by without a new study confirming the health benefits of moderate drinking. Stockwell says his meta-analysis uses ‘fully adjusted, prespecified models that accounted for effects of sampling, between-study variation, and potential confounding from former drinker bias and other study-level covariates’. Whatever this entails (he doesn’t go into detail), it results in a meta-analysis that bears no resemblance to the evidence it is supposed to be summarising.
He says:
Drinker misclassification errors were common. Of 107 studies identified [out of over 2,000 available - CJS], 86 included former drinkers and/or occasional drinkers in the abstainer reference group, and only 21 were free of both these abstainer biases.
Cool, let’s just look at those 21 studies then, shall we? Here they are in alphabetical order…
Bergmann et al. (2013) - Supports the J-Curve. Found that ‘light to moderate alcohol consumption’ was associated with a significantly lower risk of cardiovascular disease. The study includes a J-Curve graph.
Cullen et al. (1993) - Supports the J-Curve. Found that the ‘adjusted relative risk of cardiovascular disease death among moderate drinkers was 0.68 (95% CI 0.51-0.91), and that of coronary heart disease death was 0.66 (95% CI 0.45-0.98).’, i.e the risk for moderate drinkers fell by a third.
Daya et al. (2020) - Supports the J-Curve. Found that: ‘Those who reported drinking ≤1 to 7 drinks/wk had the lowest all-cause mortality rate’.
Friesema et al. (2007) - Supports the J-Curve. Found that non-drinkers tend to rate their health worse than drinkers but that ‘these differences in health do not seem to explain the observed U-shaped curve between alcohol intake and cardiovascular events and only partially explain the U-shaped curve between alcohol intake and all-cause mortality’.
Jankhotkaew et al. (2020) - Doesn’t support the J-Curve. Study from Thailand didn’t find a J-Curve.
Kapiro et al. (2019) - Supports the J-Curve. Finnish study found ‘the lowest age-sex adjusted mortality was found for those drinking 1 drink per week on average, while consistent abstainers (HR 1.27,95%CI 1.09 to 1.49) and those consuming more had significantly elevated risks.’
Kunzmann et al. (2018) - Supports the J-Curve. US study ‘supports a J-shaped association between alcohol and mortality in older adults, which remains after adjustment for cancer risk’. It contains a familiar graph.
Kono et al. (1986) - Supports the J-Curve. Found higher rates of mortality among men who drank heavily, but lower rates of heart attack mortality among moderate drinkers.
Makela et al. (2005) - Supports the J-Curve. ‘Moderate drinking is associated with a lower risk of IHD [ischemic heart disease], whereas drinking in a heavy episodic manner (often referred to as "binge drinking") is not.’ Women who drank moderately had lower rates of all cause mortality but this was not statistically significant among men.
Nakaya et al. (2004) - Doesn’t support the J-Curve. This study from Japan found a linear increase in all cause mortality risk as people drank more. The associations were not statistically significant.
Ortola et al. (2019) - Doesn’t support the J-Curve. This Spanish study didn’t find a J-Curve after making lots of adjustments.
Pednekar et al. (2012) - Doesn’t support the J-Curve. This study from India found that all cause mortality risk was higher among drinkers, regardless of quantity consumed, although this included diseases like tuberculosis which are not caused by alcohol.
Perreault et al. (2006) - Supports the J-Curve. British study found that ‘occasional drinkers’ had lower all cause mortality.
Rehm et al. (2001) - Supports the J-Curve. US study found ‘a significant influence of drinking alcohol on mortality with a J-shaped association for males and an insignificant relation of the same shape for females’.
Sadakane et al. (2009) - Supports the J-Curve. Study from Japan found ‘a near J-shaped association was identified between alcohol consumption and all-cause mortality’.
Sempos et al. (2003) - Doesn’t support the J-Curve. Study of African Americans found no J-Curve. The authors say this ‘may be the result of the more detrimental drinking patterns in this ethnicity and consequently the lack of protective effects of alcohol on coronary heart disease’.
Sun et al. (2009) - Supports the J-Curve. Study from Hong Kong found that ‘both occasional and moderate types of alcohol use were associated with lower mortality compared to never-drinkers’.
Thun et al. (1997) - Supports the J-Curve. This US study involving 490,000 people found that heart disease mortality was 30-40% lower among people who had at least one drink a day and that ‘overall death rates were lowest among men and women reporting about one drink daily’.
Tsubono et al. (1993) - Supports the J-Curve. Study from Japan found lower rates of mortality among people who drank up to 3 drinks a day.
Zaridze et al. (2014) - Insufficient evidence either way. This study from Russia found all cause mortality higher among vodka drinkers although ‘there were too few deaths to determine reliably whether a little vodka consumption provided a slight protective effect or a slight hazard.’ A ‘moderate drinker’ in this study was someone who drank up to half a litre of vodka a week.
Stockwell also includes Almeida et al. (2017) in the list of studies that were ‘free from abstainer bias’ but it is a Mendelian Randomisation study and so there is no way of knowing whether the people, who were only represented by their genes, abstained or not. I have explained before why MR studies are useless at identifying risks from voluntary activities.
If you skipped all that, the bottom line is that three-quarters of these studies, which Stockwell portrays as the gold standard, support the existence of the J-Curve. I don’t have time to go through the other 86 studies but I am familiar enough with the literature to know that they are not go to change the overall picture.
God knows what statistical jiggery-pokery he and his team engaged in to take this evidence and draw the conclusion that there are no health benefits from drinking moderately. Either you can believe that the original researchers knew what they were doing or you can believe that a neo-temperance campaigner with a bee in his bonnet can make appropriate adjustments to studies for which he doesn’t have the original data. Amongst other tricks, he seems to have reclassified occassional drinkers as teetotallers.
In the limitations section, he writes:
A major limitation involves imperfect measurement of alcohol consumption in most included studies, and the fact that consumption in many studies was assessed at only 1 point in time. Self-reported alcohol consumption is underreported in most epidemiological studies … If this is the case, the risks of various levels of alcohol consumption relative to presumed lifetime abstainers are underestimates.
This is true but he does not linger on the implications of it. People only report around 50% of what they drink (we know this because we know how much alcohol is sold). Under-reporting also means that an ‘occasional drinker’ drinks rather more often than you might think.
Therefore, if observational epidemiology shows that a risk from a certain disease begins to increase when people are drinking 20 units a week, for example, they are actually drinking 40 units a week. If we see benefits from drinking up to 10 units a week, the benefits actually apply to people who are drinking up to 20 units a week.
The effect of systematic under-reporting is to make alcohol look significantly more dangerous than it is. There has been very little effort by epidemiologists to account for this well known problem in their work.
Stockwell’s previous meta-analysis was accused of cherry-picking studies. I have my doubts about his selection process in his new meta-analysis too. He tells us that he has included all the studies published since his last effort in 2016, but I can think of several that are missing. For instance…
The National FINRISK Study of Härkänen et al. (2020) found that:
As many other observational cohort studies, also the FINRISK Study shows a J-shaped association with alcohol consumption and mortality, with moderate drinking associating to lower hazard than non-drinking.
Xi et al. (2017) studied 333,247 US adults and found that:
‘Compared with lifetime abstainers, those who were light or moderate alcohol consumers were at a reduced risk of mortality for all causes’.
Van den Brandt and Brandts (2020) looked at the odds of living to old age and found ‘the highest probability of reaching 90 was found in those consuming 5- < 15 g/d alcohol, with RR = 1.36 (95% CI, 1.20-1.55) when compared with abstainers’.
Li et al. (2020) also found that moderate alcohol consumption was associated with lower mortality, although you have to read the study carefully to see that.
The fact of the matter is that high quality studies comparing moderate drinkers to lifetime abstainers just keep on coming and they keep on finding the same thing. If this was any other field of research, scientists wouldn’t even bother studying it any more. The case would have been closed years ago.
Instead, we have a fake ‘controversy’ stirred up by people like Tim Stockwell who want to be able to claim that there is ‘no safe level’ of alcohol. The reasons for this are political and ideological. They have nothing to do with science. Studies like the one published today are not aimed at the scientific community. They are aimed at the media and, ultimately, policy-makers.
Cross-posted from the Snowdon Substack.


No comments:
Post a Comment