

There is a heartwarming video on Youtube of Jamie Oliver showing a group of children how chicken nuggets are made in an attempt to deter them from eating them. He blends up a gruesome mix of bones, skin and offal, slaps some flour on it and sticks it in the pan. ‘Now,’ he says triumphantly, ‘who would still eat this?’
The look of disappointment on Oliver’s face when every hand goes up is one of the finest images ever shown on television. It never fails to cheer me up.
After watching it for the umpteenth time, I noticed something. None of the children appears to be obese. In fact, it is difficult to spot many obese kids in any of Oliver’s series involving children. Jamie’s School Dinners was filmed at the height of the childhood obesity ‘epidemic’ and yet there was little sign of it in the cafeteria. Fat kids were also surprisingly rare in Jamie’s Return to School Dinners and Jamie’s Dream School. There were one or two, of course – as there always has been – but at a glance there were far fewer pudgy hands, chubby faces and double chins than one would expect in a country where a third of secondary school children are said to be overweight or obese (supposedly rising to 40 per cent in London).
You may have noticed the same thing if you drop your children off at the school gates or flick through the school news in your local paper. You may even be one of the bemused parents up and down the country who receives a letter from school informing you that your seemingly healthy child is borderline obese.
And yet, one in ten kids are classified as obese when they start primary school and one in five are 'obese' by the time they start secondary school. According to the latest figures, 23 per cent of 11-15 year olds are obese. And that’s before we add those who are merely overweight.
These are shocking statistics and we are reminded about them at every opportunity. Organisations like Public Health England repeat the claim that ‘more than a third of children [are] leaving primary school overweight or obese’ like a mantra whenever they have a new anti-obesity wheeze to push. So where are they all?
You can’t see them because most of them do not exist. They are a statistical invention. The childhood obesity figures in Britain are simply not worth the paper they are printed on. The childhood obesity rate is much lower than 23 per cent. Let me explain.
Obesity in adults is easy enough to measure. Body Mass Index (BMI) is weight in kilograms divided by the square of height in metres. A BMI of 30 or more is classified as obese. In theory, the cut-off of 30 is used because this is roughly the point at which being fat increases the risk of premature death, but it also happens to be a round number. A BMI of 25 or more makes you overweight, but this isn’t really based on anything. It is purely a round number.
There are well known problems with BMI, not least the fact that it does not distinguish between muscle weight and fat weight. It is excess body fat that we are interested in and this is best diagnosed by clinical examination, but when that is not possible (as when estimating figures for an entire nation), the BMI system correctly identifies obesity around 80 per cent of time.
But it doesn’t work with children. Kids are not shaped like adults, do not have the same fat/muscle ratio and are growing. They rarely have a BMI over 30. An obese child can easily have a BMI of less than 25. Moreover, obese girls have different BMIs than obese boys.
To make up for this, clinicians use a chart like the one below which gives bespoke, age-specific and gender-specific BMI cut-offs for children. For example, at the age of six and a half, boys are considered obese if their BMI exceeds 20.2. By the time the boy is eleven, the cut-off has risen to 25.1.
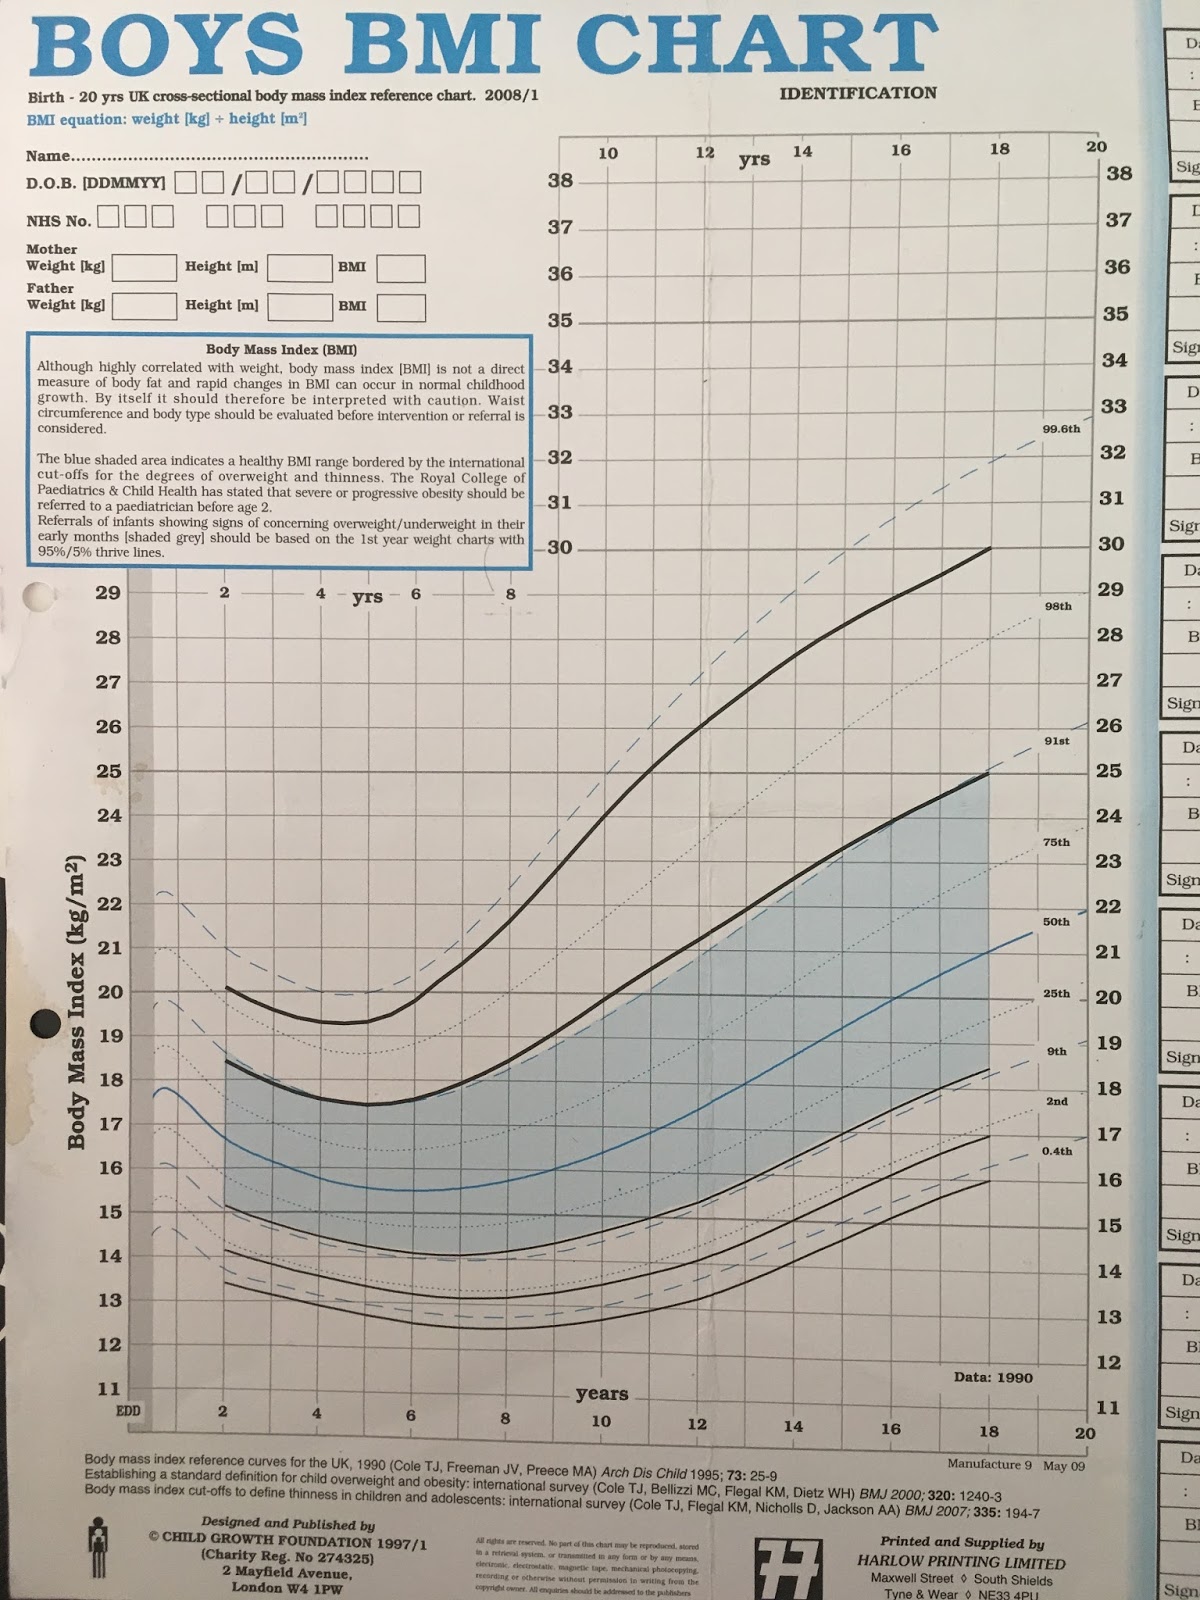
To see how these cut-offs are derived, we need to look at the work of Professor Tim Cole and his colleagues. In 1995, they published a much-cited study upon which the chart above is based. They studied the BMIs of children at different ages and divided them into percentiles. This allowed clinicians to compare the BMI of their patient to that of their peers. For example, if a girl’s BMI was at the 90th percentile, only ten per cent of her peers had a higher BMI while 90 per cent of her peers had a lower BMI.
The data used by Cole et al. were taken from between 1978 and 1990, before the rise in childhood obesity got underway and gave us a reference point from which future changes in obesity could be measured. For example, if obese 11 year old boys in 1990 had a BMI of 26 and were in the 99th (top) percentile, the obesity rate was one per cent in 1990. To update the statistics, we only need to measure today’s 11 year old boys and see how many of them would have been in the 99th percentile in 1990. If four per cent of them have a BMI over 26, they would have been in the 99th percentile and the obesity rate is four per cent.
This system made it possible to estimate child obesity rates nationwide without clinicians having to examine anybody. Detailed figures have been collected by the UK government since 1995 and all the child obesity estimates published by the NHS and Office for National Statistics are based on Cole’s reference curves from 1990.
It seems relatively straightforward. The problem is that we don’t really know how many children were obese in 1990. Cole’s solution was to infer the rate of child obesity from the rate of obesity among young adults. Common sense dictates that the child obesity and adult obesity figures should ‘link up’, which is to say that both systems should produce similar estimates for young adults. Something would be wrong if 17 year olds had an obesity rate of eight per cent while 18 year olds had a rate of one per cent, especially since BMI tends to rise with age.
Cole et al. noticed that the 20 years olds in 1990 who had a BMI of 29 (and were therefore nearly obese) appeared at the 98th percentile, which is to say that the rate of obesity was a little under two per cent. They also noticed that the 20 year olds in the 99.6th percentile (the top 0.4 per cent) had BMIs of at least 32.8. They therefore concluded that:
‘These centiles seem to be reasonable definitions of child obesity and superobesity respectively.’
They came to a similar conclusion when they published further research in 2000. Looking at BMIs in Britain between 1978 and 1993 (‘predating the recent increase in prevalence of obesity’), they found that obese 18 year olds were at the 99th percentile. In other words, only one per cent of people who had recently become adults were obese by the usual adult definition.
They found similarly low rates of obesity for 18 year olds in the Brazil and Singapore over the same time period. The Netherlands had an even lower rate of 0.3 per cent but the USA had a much higher rate of 3.3 per cent for men and 4 per cent for women.
Taken together, this suggested that the obesity rate among young British adults circa 1990 was less than two per cent and that a realistic cut-off point for childhood obesity was somewhere around the 99th percentile. In a later study, Cole and Lobstein concluded that ‘the obesity cut-off is well above the 98th centile’. It was nevertheless decided to use the 98th percentile, perhaps to err on the side of caution. Whatever the reason it was always likely to exaggerate the scale of child obesity.
Clinicians use the 98th percentile and it is the 98th percentile that is shown in the chart shown above. And yet when we measure child obesity nationally, the government uses the 95th percentile.
Why? There is no justification for it in the scientific literature other than that it is 'the convention'. Cole himself says that the methodology is ‘all built on sand.'
The most likely explanation for dropping the cut-off to the 95th percentile – if we exclude the possibility that it was deliberately intended to exaggerate the size of the problem – is that the USA did it first and we copied them. By the end of the 1990s, the USA had started using the 95th percentile as the cut-off for ‘overweight’, with the 85th percentile used to define ‘at risk of overweight’ – terms that would later be changed to ‘obese’ and ‘overweight’. This was not wholly unreasonable. The rise of obesity in America began earlier than it did in Britain and rates of obesity have always been higher. It is likely that around five per cent of American children were at least overweight, if not obese, by the end of the 1980s and would therefore have been above the 95th percentile.
But Britain is not America. Cole’s figures showed that the obesity rate among 18 year olds in Britain was much lower than it was in the USA – at one per cent – and while he recognised the need for a cut-off, he asked the obvious question:
‘… why base it on data from the United States, and why use the 85th or 95th centile? Other countries are unlikely to base a cut off point solely on American data, and the 85th or 95th centile is intrinsically no more valid than the 90th, 91st, 97th, or 98th centile.’
Whatever the reason for using the 95th percentile, it has had the effect of greatly inflating childhood obesity figures in Britain for as long as they have been recorded. It implicitly assumes that five per cent of 18 year olds were obese in 1990 when we know that the real figure was less than two per cent. Starting from this false premise, everything that follows from it is wrong. Forced to pretend that the child obesity rate in 1990 was more than twice as high as it was, we are given child obesity statistics for the present day that are likely to be off by a similar margin.
We are classifying huge numbers of children as obese who would not have been diagnosed as such by a doctor in 1990 and would not be diagnosed as such today. If you look at the chart above, you will see that the 95th percentile is not even shown on it. It is of no clinical relevance.
The result is that we get figures which defy credibility. Take a look at the latest obesity statistics for adults from the Health Survey for England. The pattern is typical of a developed country, with rates rising steadily as people get older and then dipping in old age.

Now
let’s add the childhood obesity figures which are measured in a totally
different way. As mentioned, they should link up with the adult figures, but they some nowhere near to doing so. Both groups
of children have a higher rate of obesity than the young adults, with
the rate among 11-15 year olds being more than twice as high as that of
16-24 year olds.

To
take these statistics seriously, we have to believe that obesity rises
rapidly in secondary school, affecting nearly a quarter of children,
before suddenly plummeting to barely ten per cent once they
become adults.
It has been suggested that we use the 95th percentile as the child obesity cut-off because the Americans were doing it and we copied them. The USA may well have had a child obesity rate of around five per cent in 1990. As a result, if you look their obesity stats at different ages, there is some sort of gradient. The rates rise with age, albeit with a slightly lower rate at age 12 to 19 than you might expect.

If you take Britain’s obesity figures at face value, we now have a higher rate of childhood obesity than the USA. This is almost certainly untrue. The USA has a much higher rate of adult obesity than Britain (38 per cent vs. 26 per cent). It is almost inconceivable that its rate of child obesity would be lower – you only have to visit the place to see that – but this is what happens when you apply the same relative measure to countries which start from very different places.
A few years ago I gave evidence to an Australian select committee on childhood obesity. I was amazed to hear that their rate of child obesity was just seven per cent. On paper, this is two-thirds lower than Britain’s, despite Australia having a slightly higher adult obesity rate. But once you understand that the method of counting obese children comes from the think-of-a-number school of statistics, it starts to make sense.
As these examples illustrate, using the 95th percentile to define childhood obesity makes it impossible to make meaningful comparisons between different countries. Campaigners who are unaware of this, or who simply don’t care about the facts, breathlessly claim that London has a higher rate of child obesity than New York. It probably doesn't, but we don’t have the data to prove it either way.
In order to make valid international comparisons, the World Obesity Federation – previously known as the International Obesity Task Force – uses international cut-offs devised by Tim Cole and colleagues who looked at children’s body weight in six countries in the 1980s. These international cut-offs allow researchers to make comparisons that are broadly like-for-like. Furthermore, the International Obesity Task Force has always based its definition of obesity on the 98th percentile, as Cole et al. recommended in a series of studies and as clinicians use when diagnosing patients.
The 98th percentile is a more realistic benchmark than the 95th, for the reasons outlined above, but it is still likely to exaggerate the scale of childhood obesity in Britain for three reasons. Firstly, the core assumption in all these estimates is that the proportion of children who were obese in 1990 was the same at all ages. If two per cent of 18 year olds were obese, it was assumed that two per cent of five year olds, ten year old and 15 year olds were also obese. This is an assumption of convenience which leads to over-counting. It is almost certain that obesity rates will be lower among children than among 18 year olds and that obesity rates among children rise with age.
Secondly, children tend to put on weight before a growth spurt. This renders all child obesity estimates questionable.
Thirdly, Cole et al. found that obese 18 year olds were in the 98.9th percentile in 1990. This is obviously closer to the 99th percentile than the 98th. Since 18 year olds between the 98th and 98.8th percentile were not obese, there is no reason to assume children at these percentiles were obese either.
Using the 98th percentile is therefore likely to capture all the obese cases, but it is also likely to create false positives. It is not perfect, but it has the advantage over the 95th percentile in not being utterly ridiculous. It is the measure used to estimate child obesity rates internationally and it is the measure favoured by the academics who devised the cut-off system in the first place.
When this measure is used, a very different picture emerges. The World Obesity Federations’s figures suggest that the proportion of 10 to 13 year old boys in England who are obese is 4.5 per cent. Among girls of the same age, 5.2 per cent are obese. In another estimate, they find that the obesity rate among 10-11 year olds is 2.8 per cent for boys and 2.1 per cent for girls. These are vastly lower figures than the NHS’s estimates for 11 year olds of 20 per cent and 18 per cent respectively.
This is not to deny that child obesity, like adult obesity, has risen over the years. Comparing today’s figures with those of 1990 shows a rise in children’s BMI, albeit one that peaked in 2004 before going into reverse. But we have no idea how many children are obese because the official statistics do not actually measure obesity. Claims about a quarter, or a third, of children being dangerously overweight are for the birds. The true figures – if they ever emerge – are bound to be much lower than the numbers bandied around in the newspapers.
When British parents are asked about their supposedly obese children, only 52 per cent of them say that they are ‘too heavy’. When it comes to children who are ‘overweight’ – a truly meaningless category based on the 85th percentile – only 11 per cent think they are ‘too heavy’. The children themselves agree. Only 51 per cent of ‘obese’ children and 17 per cent of ‘overweight’ children think that they are too heavy.
Rather than reassess their methodology, obesity campaigners accuse these families of deluding themselves. Parents who reject the diagnosis of an arbitrary and patently flawed mathematical assumption are accused of being ‘no longer able to tell whether their children are overweight’. They are said to be suffering from ‘Goldilocks Syndrome'.
Never mind Goldilocks. The Emperor’s New Clothes is the more appropriate fairy tale analogy here. We are told that obese children roam the streets in vast numbers: one in five 11 year olds, rising to one in three if you include the ‘overweight’. No one can see this many obese kids with their own eyes and yet we go along with the illusion, perhaps assuming that they live elsewhere. If you met most of these ‘overweight’ kids, you would probably agree with their parents that they are not fat. A doctor who examined the ‘obese’ kids would reject the diagnosis of obesity in hundreds of thousands of cases.
There was never any justification for the British government dropping the threshold to the 95th percentile. The result of this error is that at least three out of four children who are currently classed as obese in Britain would not be described as such by a doctor. You would not describe them as obese if you saw them. The system used by our statistics agencies is not fit for purpose – unless the purpose is to vastly inflate the scale of the problem.
This is an edited version of two articles published by Spectator Health in February/March 2018
No comments:
Post a Comment